Daedalus is a data rendering and data manipulation tool enabling powerful, insightful, and fast reporting.
 Tell a Story
Present data piecewise in logical sections, giving context and explanations to help elucidate findings.
- Data can be presented using separate files, and referenced in other files
- Data representations can be intermixed with bodies of text
- A workspace takes on a file and folder hierarchy
Fast Consistent ReportingQuickly reproduce reports when data changes with minimal user input.
- Reports are plaintext
- Easy sharing
- Use with version control
Find out more
📊 Charting
🎞️ Media Embedding
🖼️ Presentation
🔃 Flowcharts
➗ Data Processing
🌐 Hosting
📊 Charting
Create interactive charts quickly. Spend more time on data analysis rather than on chart construction.
Define charts with simple text configurations, the documentation defines an example of a bar plot:
:BarPlot
data = "/data/tropical-cyclones.csv"
ycol = "Name"
barmode = "stack"
include = [4, 5]
daedalus parses this configuration and renders the plot: 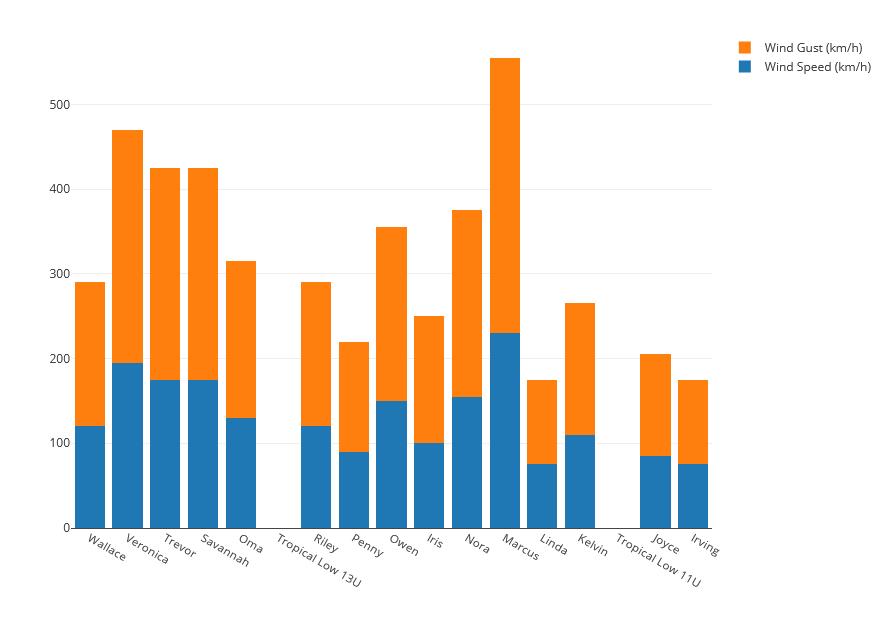
This is only a screenshot! Checkout the live documentation defined in daedalus.
🎞️ Media Embedding
Embed images as standalone files or into reports. Present multiple images within the same area to provide a slideshow style widget. Media is not just limited to images! Embed videos straight into reports!
🖼️ Presentation
Present data not as a single report but as a workspace.
Structure a workspace using files and folders, and reference the required components within reports. This provides a mechanism to present complex reports without having to interact with unwieldy monolithic reports. The file-based approach also allows for granular updates, especially when updates to data occur. Simply update the backing data file and linked charts/images/processing can rebuild themselves with the new data.
🔃 Flowcharts
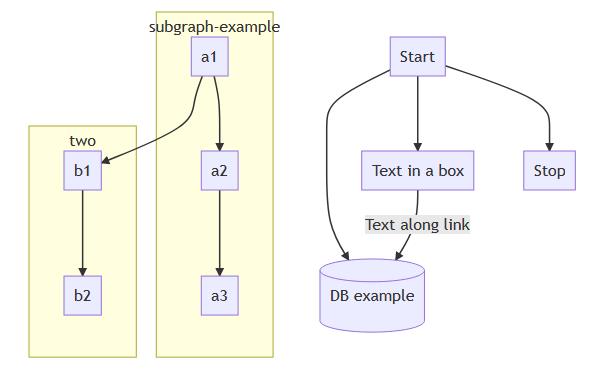
daedalus supports text based flowcharts.
Flowcharts are defined using mermaid syntax. This text based approach has multiple benefits:
- Can be version controlled using well-known version control tools,
- Is easy to share and see examples for,
- Flowcharts can be built programmatically.
The text is parsed and rendered into a static flowchart:
➗ Data Processing
Avoid tedious data transformations when a data source is updated.
Often data must be transformed to suit a visual representation. daedalus encourages doing these transformations using its bespoke expression system. Transformations such as filtering and sorting data are easily defined with a concise, intuitive syntax, but the system is not just limited to simple transformations! Grouping, subtotalling, accumulations, and much more are all possible. There is even an example of estimating 𝜋 using a Monte Carlo simulation!
Using the expression system is encouraged to:
- Quickly reproduce reports when input data changes,
- Investigate large datasets without having to load them into a program,
- Collate different datasets.
The local daedalus program provides a terminal REPL (read-evaluate-print-loop) which can be used to quickly prototype expressions.
🌐 Hosting
Share a live instance of a workspace.
Create an account to host workspaces online. Each workspace runs its own daedalus instance and provides live updating as the workspace is added to or altered.
- Easy: Create new workspaces with a click of a button.
- Fast: Upload whole workspaces quickly.
- Shareable: Share and revoke links to a workspace.
- Secure: Protect links with a password. All server communications are encrypted over HTTPS.